Total Water Levels Tool
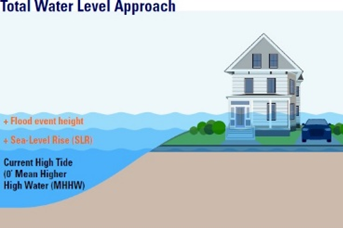
The Total Water Levels (TWL) Tool helps you develop flood exposure analyses using the best available science for sea-level rise (SLR). You can analyze neighborhood, municipality-wide, and regional exposures to future flood hazards. You should NOT make site level engineering and design decisions.
Using the TWL tool you can create maps that illustrate three flooding types: permanent inundation (i.e., the future Mean Higher High Water line); high tide flooding (i.e., sunny-day flooding, nuisance floods); and extreme coastal flooding from storms (i.e., hurricanes and nor’easters). The TWL method is based on NOAA’s “What Will Adaptation Cost” guide and is consistent with the 2019 Science and Technical Advisory Panel report for sea-level rise in New Jersey.
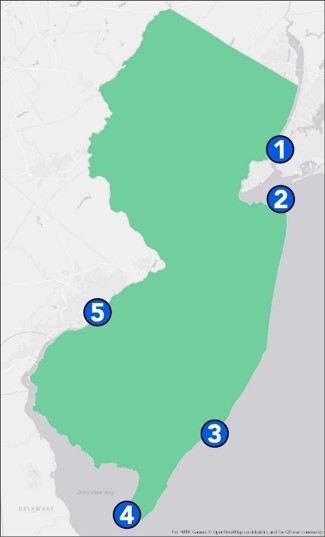
Select a NOAA Tide Gauge
Step 1 - Choose the nearest tide gauge to your analysis area OR select the ‘most suitable’ tide gauge based on your own judgment. For example, southern Monmouth County, NJ coastal flood height characteristics could be more similar to Atlantic City, even though the Sandy Hook gauge is in Monmouth County. If you are unsure of which gauge to choose, you should use the two closest gauges, and then choose the one that generates the highest water levels exposure analysis.
Step 1 of 5
Select Emission Scenario
Step 2 - The amount of future sea level rise is dependent on the amount of global greenhouse gas (GHG) emissions. Higher GHG emissions lead to larger and more rapid global temperature changes, resulting in higher SLR numbers.
- High GHG emissions - Corresponds to a future consistent with the strong, continued growth of fossil fuel consumption.
- Moderate GHG emissions - Corresponds to a future consistent with current global policies.
- Low GHG emissions - Corresponds to a future consistent with the global goal of limiting warming to 2°C above early industrial (1850-1900) levels.
Step 2 of 5
Select a Planning Horizon
Step 3 - Customize your planning horizon which is the decade you want to use for your analysis. Developing water levels for several different planning horizons is beneficial. As an example, you might choose:
- 2030 to represent a near-term planning horizon for assets that may be short-lived.
- 2050 to represent longer-term regional planning horizons (e.g., long-range transportation planning) or the life of a current 30-year mortgage. It is also the currently assessed point to which sea-level rise values are “locked in” regardless of whether emissions increase or decrease.
- 2100 to represent a planning horizon for long-lived assets that will last for decades or investments that need to be designed to adapt to uncertain long-term projections for sea-level rise.
- 2150 to represent a planning horizon considering multiple future generations and policy decisions through the early part of the next century.
Step 3 of 5
Select a Sea Level Rise Estimate
Step 4 Analyzing at least two sea-level rise estimates is beneficial. Choosing one estimate in the ‘likely’ range, along with the ‘high-end’ estimate will allow you to see how a range of SLR scenarios change community level exposures to flooding.
You can choose between the following SLR estimates:
‘High-End’ Estimates:
There is less than a 5% chance of exceeding the SLR height value indicated. Using a high-end estimate is especially important for planning assets with long lifetimes (e.g., a bridge), or limited ability to move out of harm’s way (e.g., a wastewater treatment plant).
Likely estimates:
- There is less than a 17% chance of exceeding the SLR height value indicated
- There is approximately a 50% chance of exceeding the SLR height value indicated
- There is at least an 83% chance of exceeding the SLR height value indicated
‘Low-End’ Estimate:
There is at least a 95% chance of exceeding the SLR height value indicated.
Step 4 of 5
Select a Flood Event
Historical Events
Step 5 - Choose between Flood Events Height using tide gauge specific data:
- Historical Storm flood heights (e.g., Sandy)
- Mean Higher High Water (MHHW)
- NOAA’s Annual Exceedance Probabilities (AEP), and
Flood event water levels are specific to each tide gauge and come from NOAA’s Extreme Water Levels statistics program. Mean Higher High Water reflects permanent inundation, or where residents’ feet will be wet on an almost daily basis. Selecting other water levels reflects recurring floods (i.e., the 99% AEP) or episodic flood events that could result from coastal storms (i.e., the 1% AEP). You can also choose historic flood events (like Sandy) to see how previous storms would look like in the future.
Step 5 of 5
Total Water Level Summary
Tide Gauge: Atlantic City, NJ
Emission Scenario: Moderate emissions
Timeframe: 2030 Planning Horizon
SLR Estimate: 83% Probability - 0.6 ft
Flood Event:
Total Water Level Estimate: N/A ft.
Total Water Level Estimate Mapper: N/A ft.
Results - The resultant Total Water Level is rounded to the nearest whole foot. The TWL inundation map represents ‘still water‘, which reflects the astronomical tide, the storm surge, and limited wave setup caused by breaking waves.
The Total Water Level does not portray wave runup, the movement of water up a slope. Therefore, the inundation mapping more closely corresponds to FEMA’s Still Water Flood Elevations (SWEL), not the Base Flood Elevation (BFE). Therefore, this analysis could under-represent the amount of inundation, as the calculations do not consider wave velocity and other dynamic effects from storms.
Summary
Basemap Layers
Select from various basemap layers to be displayed on the mapping interface. For information on other basemaps please see https://arcg.is/11iLrH
-
 Streets -
This map features highway-level data for the world and street-level data for North America, Europe, and other parts of the world.
Streets -
This map features highway-level data for the world and street-level data for North America, Europe, and other parts of the world. -
 Satellite -
This map features satellite imagery for the world and high-resolution aerial imagery for many areas.
Satellite -
This map features satellite imagery for the world and high-resolution aerial imagery for many areas. -
 Hybrid -
This map features satellite and high-resolution aerial imagery for the world with political boundaries and place names for reference purposes.
Hybrid -
This map features satellite and high-resolution aerial imagery for the world with political boundaries and place names for reference purposes. -
 National Geographic -
This map features the National Geographic World Map, which is a cartographically rich and distinctive reference map of the world.
National Geographic -
This map features the National Geographic World Map, which is a cartographically rich and distinctive reference map of the world. -
 Topographic -
This topographic map is designed to be used as a basemap and a reference map.
The map has been compiled by Esri and the ArcGIS user community from a variety of best available sources.
Topographic -
This topographic map is designed to be used as a basemap and a reference map.
The map has been compiled by Esri and the ArcGIS user community from a variety of best available sources. -
 Gray -
This map is designed to focus attention on your thematic content by providing a neutral background with minimal colors, labels, and features.
Gray -
This map is designed to focus attention on your thematic content by providing a neutral background with minimal colors, labels, and features. -
 Dark Gray -
This map is designed to focus attention on your thematic content by providing a neutral background with minimal colors, labels, and features.
Dark Gray -
This map is designed to focus attention on your thematic content by providing a neutral background with minimal colors, labels, and features. -
 Open Street Map -
This web map references the live tiled map service from the OpenStreetMap project.
OpenStreetMap (OSM) is an open collaborative project to create a free editable map of the world.
Open Street Map -
This web map references the live tiled map service from the OpenStreetMap project.
OpenStreetMap (OSM) is an open collaborative project to create a free editable map of the world. -
 Streets Night - This web map provides a detailed vector basemap for the world featuring a custom “night time” street map style.
 -
 Streets Navigation - This web map provides a detailed vector basemap for the world featuring a custom navigation map style.
Welcome to New Jersey’s Transit Friendly Data Application
New Jersey’s Transit Friendly Data Application allows users to map, report, and download a range of land use, travel, public transit, demographic, and real estate development data. The data available in the application are useful to elected officials, community and economic development professionals, real estate developers, land use planners, transit service planners, and others engaged in the land use and transportation planning process.
New Jersey’s Transit Friendly Data Application was developed by researchers from the Alan M. Voorhees Transportation and the Office of Research Analytics at Rutgers University, in partnership with NJ TRANSIT and the North Jersey Transportation Planning Authority. Funding for the application was provided by NJ TRANSIT and the Federal Highway Administration.